-FINAL(01-00)-White&Blue-01.svg)

Website traffic metrics are often an afterthought. What most people don’t think about is how critical these metrics are in helping you understand the efficacy of the marketing strategies you have in place.
One of the main goals of inbound marketing is to generate high-quality traffic to your website. The more (quality) traffic that your site receives, the more potential leads there will be to convert. There are many different marketing tactics that can help to achieve that goal; however, you don’t know if your tactics are working if you haven’t identified metrics to track that will help prove the efficacy of what you’re doing.
Today we’re going to identify 5 critical website traffic metrics that you should watch to help you track and optimize your marketing strategies.
The top 5 website traffic metrics you should be tracking
While the basic website traffic metrics can tell you how many people have visited your site on a daily basis (or weekly or monthly basis, or even who is on the site real-time), that information is too broad to act on, even if it can tell you whether your traffic is declining, stagnating, or growing. The following are five website traffic metrics that you can actually use to take action:
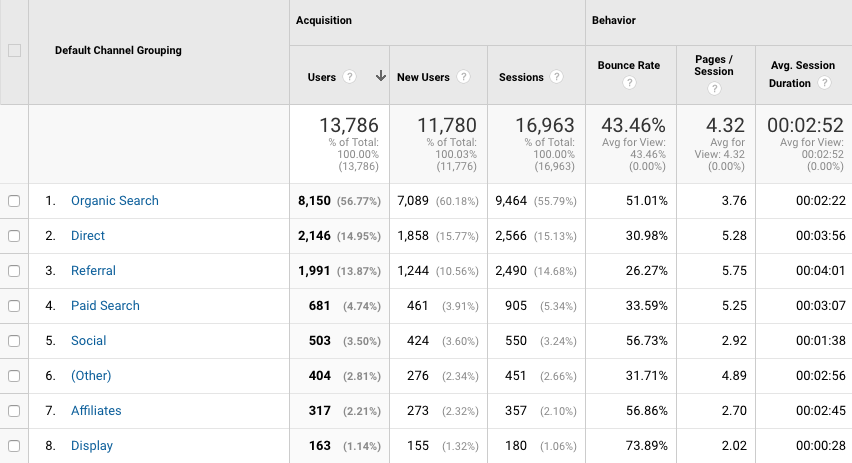
1. Traffic Sources
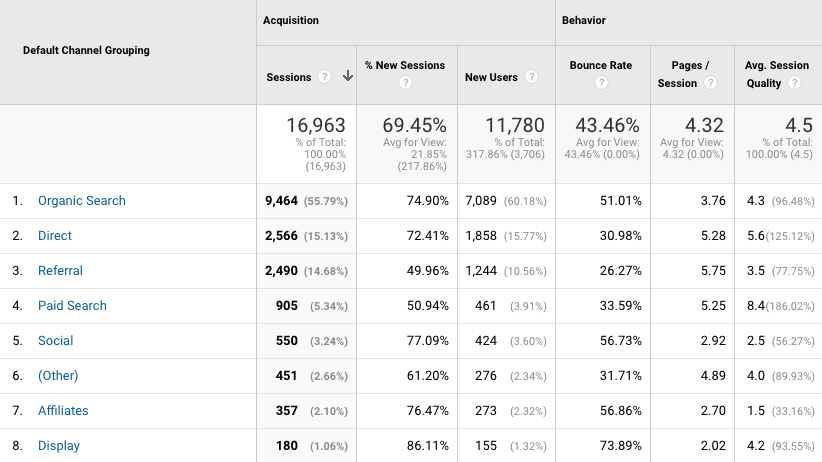
What: Traffic Sources are more helpful to track than overall traffic because it tells you where your traffic is coming from.
How: You can track the Traffic Sources metric using Google Analytics.
Path: Google Analytics > Acquisition > All Traffic > Channels
Why: Basically, it will tell you how many of your visitors are coming to your site via organic search, referrals, through direct visits (by typing your URL into the browser), or through social media. This means that if the majority of your visitors are coming through organic search, it means you likely have an effective SEO strategy in place; however, your social media marketing strategy may need some work if the number of visitors coming from social channels is low.
It is beneficial to have a well-balanced number of visitors from each source. A well-balanced content strategy that utilizes effective messaging and call-to-action is going to encourage engagement from all of your sources. It is important to pay attention and notice if you see a sharp decline or stagnation in growth. This might be a sign that your strategy needs some tweaking.
2. New Vs. Returning Visitors
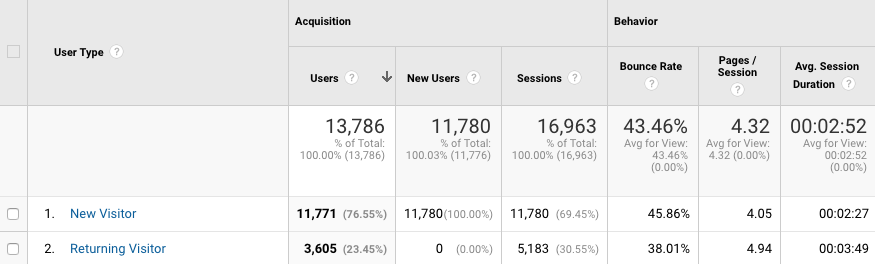
What: The New vs. Returning Visitors report identifies new and returning users to your site (obviously). It’s useful in understanding how many people you might potentially be attracting back to your site.
How: The report tracks the Client ID of a user on your website. It assigns a random identification number that marks the browser and device of the user when they visit your site. When they return later it can recognize them and track their information. Not all new visitors will be new to your site, however. If someone visits in a different browser or from a different device they’ll be assigned a new Client ID code and will appear as a second visitor in this report.
Path: Google Analytics > Audience > Behavior > New vs. Returning
Why: The New Vs. Returning Visitors metric is very helpful. Getting a lot of new visitors is great since it means you’re increasing brand exposure. If you’re not getting a lot of new visitors, you may need to work on things like SEO or social media marketing. However, returning visitors are even more important. This is because a returning visitor is much more likely to convert since they’re obviously interested enough to come back to your website.
If you don’t have many returning visitors, it means that you need to work on your content strategy. It’s good content that helps bring visitors back. You should aim to have roughly 25 to 50 percent of your total number of visitors be returning visitors.
3. Bounce Rate
What: The Bounce Rate is the percentage of visitors that leave your website almost immediately after arriving. Basically, visitors who come to a web page but do not engage at all–meaning that they do not click on any links and simply leave the site altogether soon after. The less time a visitor spends on your site and the less they engage with it, the less of a chance you have of converting visitors. This means that a high bounce rate is a bad thing–and not only does it indicate that you’re missing out on potential conversions, but it can hurt your SEO as well. Bounce rates are traditionally lower for returning visitors to your website.
How: Google Analytics begins tracking a user the moment they land on your site. Bounce rate identifies those users who leave your website from the landing page they came to without any action. For example, if a user was directed to your website from an advertisement but clicked out or went back without action they have bounced.
Path: Google Analytics > Audience > Behavior > Session Quality
Why: Bounce Rates won’t tell you why visitors are leaving, but they will tell you that there’s something wrong with whatever marketing effort is bringing them to that specific page. For example, maybe the external link that’s sending them to that page isn’t using a description that’s accurate, meaning that visitors aren’t finding what they’re expecting to find once they reach your site.
Similarly, you may not be using keywords that are relevant to the content on that page. If the content is not relevant to the keywords being used by your visitors, they will likely leave right away.
4. Average Time on Site
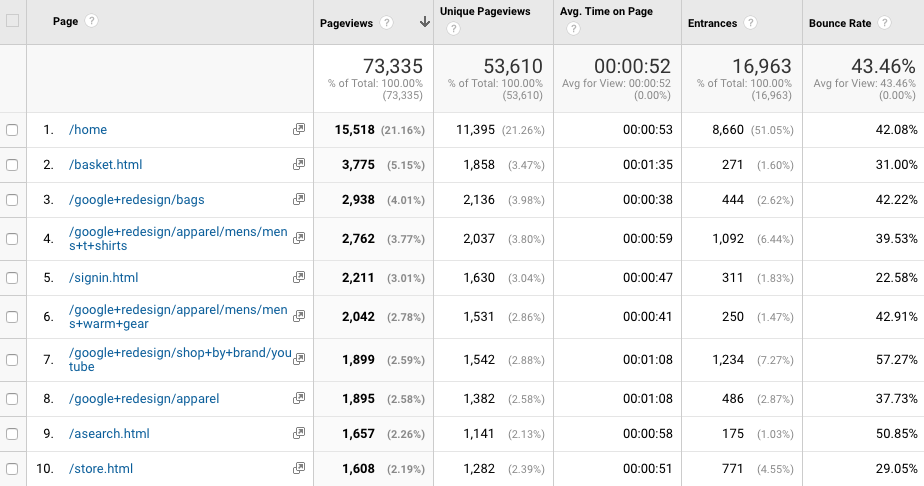
What: While the Bounce Rate indicates where you’re failing to engage visitors, the Average Time on Site metric gives you a good idea of how effectively you’re engaging your visitors throughout your site. It can help pinpoint certain issues that need to be addressed, such as poor navigation or poor (or a lack of) content. One thing to keep in mind–visitors behave differently on desktops than they do on mobile devices. They are more likely to spend a longer amount of time exploring a website from their phone than they are from their desktop or laptop.
How: Path: Google Analytics > Behavior > Site Content > All Pages
Why: Mobile use is an increasing way everyone is accessing your content. Even traditional professionals are relying on their phone to connect with organizations. 58% of site visits are from mobile applications. Your content NEEDS to be mobile friendly. Regardless of whether it is short-form, long-form, or video: it will be accessed from a mobile device or tablet. If you’re not optimizing for it you’re missing out.
5. Conversion Rate
What: The Conversion Rate gives you an idea of the quality of your leads as well as the effectiveness of your website overall. A low conversion rate and a high traffic rate means that your off-site marketing efforts may be working well, but your on-site marketing efforts are not.
How: Through Google Analytics you can establish a wide variety of goals and track the conversion rate through them, and it doesn’t have to necessarily be ‘percent of users reaching the order confirmation page from ad campaign’. Your conversion rate is calculated by the percent of users who follow a path to complete a goal.
One goal might look something like this: the percent of users who sign up for a newsletter from organic search. You might have a goal conversion of something like 2.0%. Google would then track users who came to the site through organic search and ended up on a confirmation page of sorts thanking people for signing up for a newsletter. It would track the percentage of people followed the path and that would be your rate.
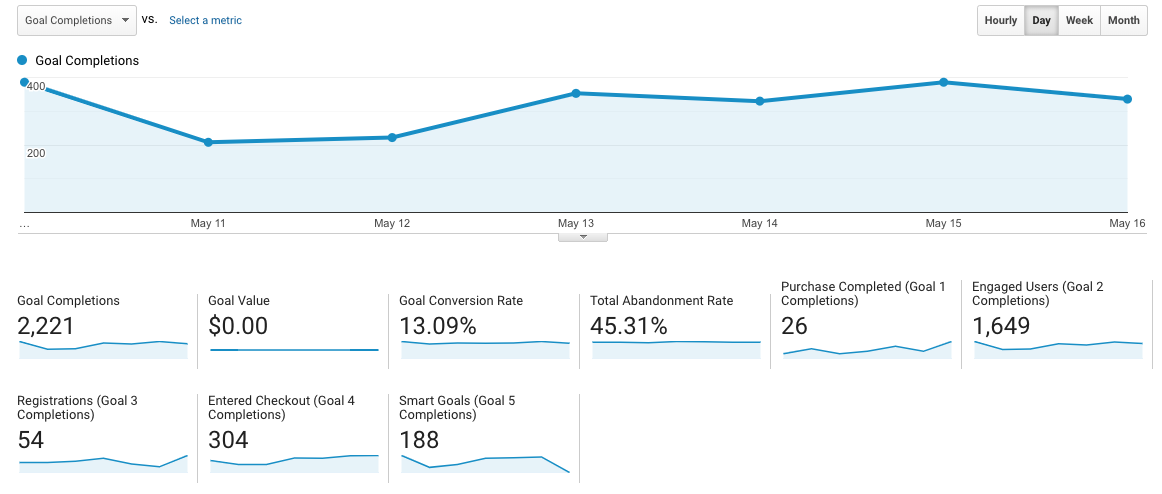
Path: Google Analytics > Conversion > Overview
Why: Use the Conversion Rate in conjunction with the Traffic metric to get an overall idea of your website’s performance and then work your way back using the previously listed metrics to identify your problem areas.
By tracking these five metrics, you should be able to identify what tactics are successfully helping you to generate more website traffic and what tactics are underperforming. This allows you to adjust your marketing strategy where needed so that you’re not wasting resources on failing tactics.
Psst…curious about how many visitors you need to get to your site to get the conversions you need? Check out our FREE lead generation calculator here.
The Too Long; Didn’t Read on Website Traffic Metrics
These 5 traffic metrics will help your marketing team figure out what strategies are performing well and which need to be adjusted. Identifying your traffic sources will help with understanding where your visitors are coming from. Identifying which users are returning and which are new will help your team be able to differentiate areas that may need to be further targeted like SEO or social media. With that, analyzing how long users are spending on your site and the bounce rate will help identify problem areas when you send traffic to the site.

Traffic Metrics work to help your team find what areas are doing well and what parts of your website needs help. Metrics are important and provide valuable information but to find that you need to evaluate the data to see what you need to focus on.